Market Outlook
December 22, 2016
Market Cues
Domestic Indices
Chg (%)
(Pts)
(Close)
Indian markets are expected to open flat tracking the SGX Nifty.
BSE Sensex
(0.2)
(66)
26,242
Nifty
(0.3)
(21)
8,061
US stock indices closed slightly lower due to profit booking and low volumes. The
National Association of Realtors(NAR) released a report showing an unexpected
Mid Cap
(0.2)
(20)
11,985
continued increase in existing home sales in the month of November. Existing home
Small Cap
0.0
4
11,951
sales climbed 0.7 percent to an annual rate of 5.61 million in November against an
Bankex
0.1
29
20,692
expectation of existing home sales rate of 5.54. Biotechnology stocks were down
significantly, dragging the NYSE Arca Biotechnology Index down by 1.9 percent.
Global Indices
Chg (%)
(Pts)
(Close)
The FTSE 100 had a flat trading session due low volumes. Barclays fell by 0.22
Dow Jones
(0.2)
(33)
19,942
percent, while Royal Bank of Scotland advanced 0.93 percent. This was after news
Nasdaq
(0.2)
(13)
5,471
that both banks were fined by the Swiss competition regulator for interest rate
rigging. The U.K. budget deficit narrowed in November. Public sector net borrowing
FTSE
(0.0)
(3)
7,041
excluding intervention dropped by GBP 0.6 billion from prior year to GBP 12.6
Nikkei
(0.3)
(50)
19,444
billion in November. The expected level was GBP 12.2 billion.
Hang Seng
0.4
81
21,810
Indian markets opened mildly positive but selling by FII’s resulted in the market
Shanghai Com
1.1
35
3,137
falling for the sixth straight session. Investor sentiment was negative due to concerns
regarding demonetisation and the impact it would have on the economy. FMCG
Advances / Declines
BSE
NSE
was the biggest loser for the session and closed down 1.14 percent. The IT index lost
Advances
1,177
693
its gains from the last session to close down 0.92 percent. Metal and Energy indices
closed up by 0.53 and 0.63 percent respectively.
Declines
1,428
904
Unchanged
171
78
News Analysis
Bombay Dyeing Retail to launch premium textile products
Volumes (` Cr)
RCom makes `11,000cr tower deal with Brookfield Infra
BSE
2,221
Detailed analysis on Pg2
NSE
14,048
Investor’s Ready Reckoner
Key Domestic & Global Indicators
Net Inflows (` Cr)
Net
Mtd
Ytd
Stock Watch: Latest investment recommendations on 150+ stocks
FII
(621)
(1,702)
25,575
Refer Pg5 onwards
MFs
485
621
38,806
Top Picks
CMP
Target
Upside
Top Gainers
Price (`)
Chg (%)
Company
Sector
Rating
(`)
(`)
(%)
Rcom
37
6.9
Amara Raja Batt. Auto & Auto Ancill.
Buy
888
1,167
31.5
Welcorp
80
6.2
Alkem Laboratories Pharmaceuticals
Buy
1,626
1,989
22.3
Pcjeweller
381
6.0
HCL Tech
IT
Buy
820
1,000
21.9
Power Grid Corp. Power
Buy
183
223
21.6
Dlf
118
4.1
Navkar Corp.
Others
Buy
168
265
57.8
Ramcocem
539
3.8
More Top Picks on Pg3
Top Losers
Price (`)
Chg (%)
Key Upcoming Events
Previous
Consensus
Date
Region
Event Description
Aloktext
3
(10.2)
Reading
Expectations
Ceatltd
1,150
(4.5)
Dec 22 US
GDP QoQ (Annualised)
3.2
3.3
Dec 22 US
Initial Jobless claims
254.0
258.5
Network18
34
(4.1)
Dec 23 UK
GDP (YoY)
2.3
2.3
Escorts
286
(4.1)
Dec 23 China
PMI Manufacturing
51.7
51.6
Pel
1,549
(3.6)
Dec 27 US
New home sales
563.0
575.0
As on December 21, 2016
More Events on Pg4
Market Outlook
December 22, 2016
News Analysis
Bombay Dyeing Retail to launch premium textile products
In an attempt to expand its product offerings Bombay Dyeing is launching a range
of functional textile products targeted at active life of youths as well as the launch
of an e-commerce portal by early next year.
With this move the company aims to treble its retail turnover to `1,000cr by 2020
from over `300cr in FY16. The e-commerce portal is expected to go live by March
2017 and the company sees online sales to contributing 8-10% to the total
revenue by 2020.
A part of the
`1,845cr Bombay Dyeing and Manufacturing Company Ltd
(BDMCL), Bombay Dyeing Retail has an over 30% share in the organised bed,
bath and coordinates market which is valued at around `1,000cr. The company
has over the last several months moved away from manufacturing to a more retail
service oriented company, with over 90% of its requirement now being outsourced
to manufacturing partners.
While currently, Bombay Dyeing Retail contributes around 17% to BDMCL, by
2020, the company expects the same to grow to over 30%. This, the company is
banking on the current expansion plan being undertaken, which by 2020 looks to
see BDR's traditional textile multi-branded outlets (MBOs) grow from 5,000 to
10,000 and franchised stores from 200 to 500.
RCom makes `11,000cr tower deal with Brookfield Infra
Reliance Communications (RCom) signed binding agreements with Canada-based
Brookfield Infrastructure and institutional partners to sell its tower business for an
upfront cash payment of `11,000cr, the proceeds of which will be used to reduce
debt.
The tower business will be demerged into a separate company, which will be 100
percent owned and independently managed by Brookfield Infra. RCom and
Reliance Jio will continue as major long-term tenants of the tower company.
Economic and Political News
GST Council to begin meeting to consider model GST laws
I-T Dept detects `3,300cr in un-disclosed income; `92cr worth of new notes
seized till date
Banks to stop questioning depositors depositing old notes
Corporate News
Airtel to offer 3 months free data to fixed-line customers
Tata Steel EGM to decide status of Nusli Wadia as Independent Director
Quess Corp and TeamLease Services benefiting from demonetisation due to
spike in the demand for temporary staff
Market Outlook
December 22, 2016
Top Picks ★★★★★
Large Cap
Market Cap
CMP
Target
Upside
Company
Rationale
(` Cr)
(`)
(`)
(%)
To outpace battery industry growth due to better
Amara Raja Batteries
15,160
888
1,167
31.5
technological products leading to market share gains in
both the automotive OEM and replacement segments.
Strong growth in domestic business due to its leadership in
Alkem Laboratories
19,445
1,626
1,989
22.3
acute therapeutic segment. Alkem expects to launch more
products in USA, which bodes for its international business.
The stock is trading at attractive valuations and is factoring
HCL Tech
1,15,755
820
1,000
21.9
all the bad news.
Back on the growth trend; expect a long term growth of 14%
Infosys
2,30,544
1,004
1,249
24.4
to be a US$20bn in FY2020.
Strong order backlog and improvement in execution would
Larsen & Tourbo
1,25,198
1,342
1,634
21.7
trigger the growth for the L&T
One of the largest pharma companies with strong
international presence. It has a rich pipeline of ANDAs
Lupin
66,164
1,466
1,809
23.4
which is also one of the largest among the generic
companies.
Going forward, we expect the company to report strong
Power Grid Corporation
95,947
183
223
21.6
top-line CAGR of ~16% and bottom-line CAGR of ~19%
over FY16-18 on back of strong capitalization guidance
Source: Company, Angel Research
Mid Cap
Market Cap
CMP
Target
Upside
Company
Rationale
(` Cr)
(`)
(`)
(%)
We expect the company would report strong profitability
Asian Granito
674
224
351
56.7
owing to better product mix, higher B2C sales and
amalgamation synergy.
Among the top 4 players in the consumer durables segment.
Bajaj Electricals
2,181
216
274
26.9
Improved profitability backed by turn around in E&P
segment. Strong order book lends earnings visibility.
Favourable outlook for AC industry augurs well for Cooling
Blue Star
4,393
460
634
37.8
products business which is outgrowing the market. EMPPAC
division's is likely to turn around on improving economy
With a focus on the low and medium income (LMI)
Dewan Housing Finance
7,388
236
350
48.3
consumer segment, the company has increased its presence
in tier-II & III cities where the growth opportunity is immense.
Strong loan growth backed by diversified loan portfolio and
adequate CAR. ROE & ROA likely to remain decent as risk of
Equitas Holdings
4,937
147
235
59.6
dilution remains low. Attractive valuations considering
growth.
Economic recovery to have favourable impact on advertising
& circulation revenue growth. Further, the acquisition of a
Jagran Prakashan
5,559
170
225
32.3
radio business (Radio City) would also boost the company's
revenue growth.
Speedier execution and speedier sales, strong revenue
Mahindra Lifespace
1,457
355
522
47.1
visibilty in short-to-long run, attractive valuations
We expect the company to report strong growth on back of
healthy growth in domestic branded sales (owing to
Mirza International
1,022
85
107
26.0
aggressive ad spend and addition in the number of EBOs &
multi-brand outlets [MBOs]) and healthy export revenues.
Massive capacity expansion along with rail advantage at
Navkar Corporation
2,395
168
265
57.8
ICD as well CFS augurs well for the company.
Strong brands and distribution network would boost growth
Siyaram Silk Mills
1,153
1,230
1,605
30.6
going ahead. Stock currently trades at an inexpensive
valuation.
Market leadership in Hindi news genre and no. 2 viewership
ranking in English news genre, exit from the radio business,
TV Today Network
1,586
266
385
44.8
and anticipated growth in ad spends by corporate to benefit
the stock.
Source: Company, Angel Research
Market Outlook
December 22, 2016
Key Upcoming Events
Global economic events release calendar
Date
Time
Country
Event Description
Unit
Period
Bloomberg Data
Last Reported Estimated
Dec 22, 2016
7:00PM
US
GDP Qoq (Annualised)
% Change
3Q T
3.20
3.30
7:00PM
US
Initial Jobless claims
Thousands
Dec 17
254.00
257.00
Dec 23, 2016
3:00PM
UK
GDP (YoY)
% Change
3Q F
2.30
2.30
6:30AM
China
PMI Manufacturing
Value
Dec
51.70
51.60
Dec 27, 2016
8:30PM
US
New home sales
Thousands
Nov
563.00
575.00
Jan 1, 2017
8:30PM
US
Consumer Confidence
S.A./ 1985=100
Dec
107.10
108.25
Jan 2, 2017
2:25PM
Germany
PMI Manufacturing
Value
Dec F
55.50
55.50
Jan 3, 2017
3:00PM
UK
PMI Manufacturing
Value
Dec
53.40
53.30
2:25PM
Germany
Unemployment change (000's)
Thousands
Dec
(5.00)
(5.00)
Jan 4, 2017
2:25PM
Germany
PMI Services
Value
Dec F
53.80
53.80
Jan 6, 2017
7:00PM
US
Change in Nonfarm payrolls
Thousands
Dec
178.00
175.00
7:00PM
US
Unnemployment rate
%
Dec
4.60
4.70
Jan 8, 2017
China
Exports YoY%
% Change
Dec
(1.60)
--
Jan 9, 2017
China
Consumer Price Index (YoY)
% Change
Dec
2.30
--
Jan 10, 2017
India
Imports YoY%
% Change
Dec
10.40
--
3:00PM
UK
Industrial Production (YoY)
% Change
Nov
(1.10)
--
Jan 11, 2017
India
Exports YoY%
% Change
Dec
2.30
--
Jan 12, 2017
5:30PM
India
Industrial Production YoY
% Change
Nov
(1.90)
--
Jan 13, 2017
US
Producer Price Index (mom)
% Change
Dec
--
--
Jan 16, 2017
12:00PM
India
Monthly Wholesale Prices YoY%
% Change
Dec
3.15
--
Jan 17, 2017
3:00PM
UK
CPI (YoY)
% Change
Dec
1.20
--
China
Industrial Production (YoY)
% Change
Dec
6.20
--
China
Real GDP (YoY)
% Change
4Q
6.70
--
Jan 18, 2017
7:00PM
US
Consumer price index (mom)
% Change
Dec
0.20
--
3:30PM
Euro Zone
Euro-Zone CPI (YoY)
%
Dec F
0.60
--
7:45PM
US
Industrial Production
%
Dec
(0.44)
--
7:00PM
US
Housing Starts
Thousands
Dec
1,090.00
--
Source: Bloomberg, Angel Research
Market Outlook
December 22, 2016
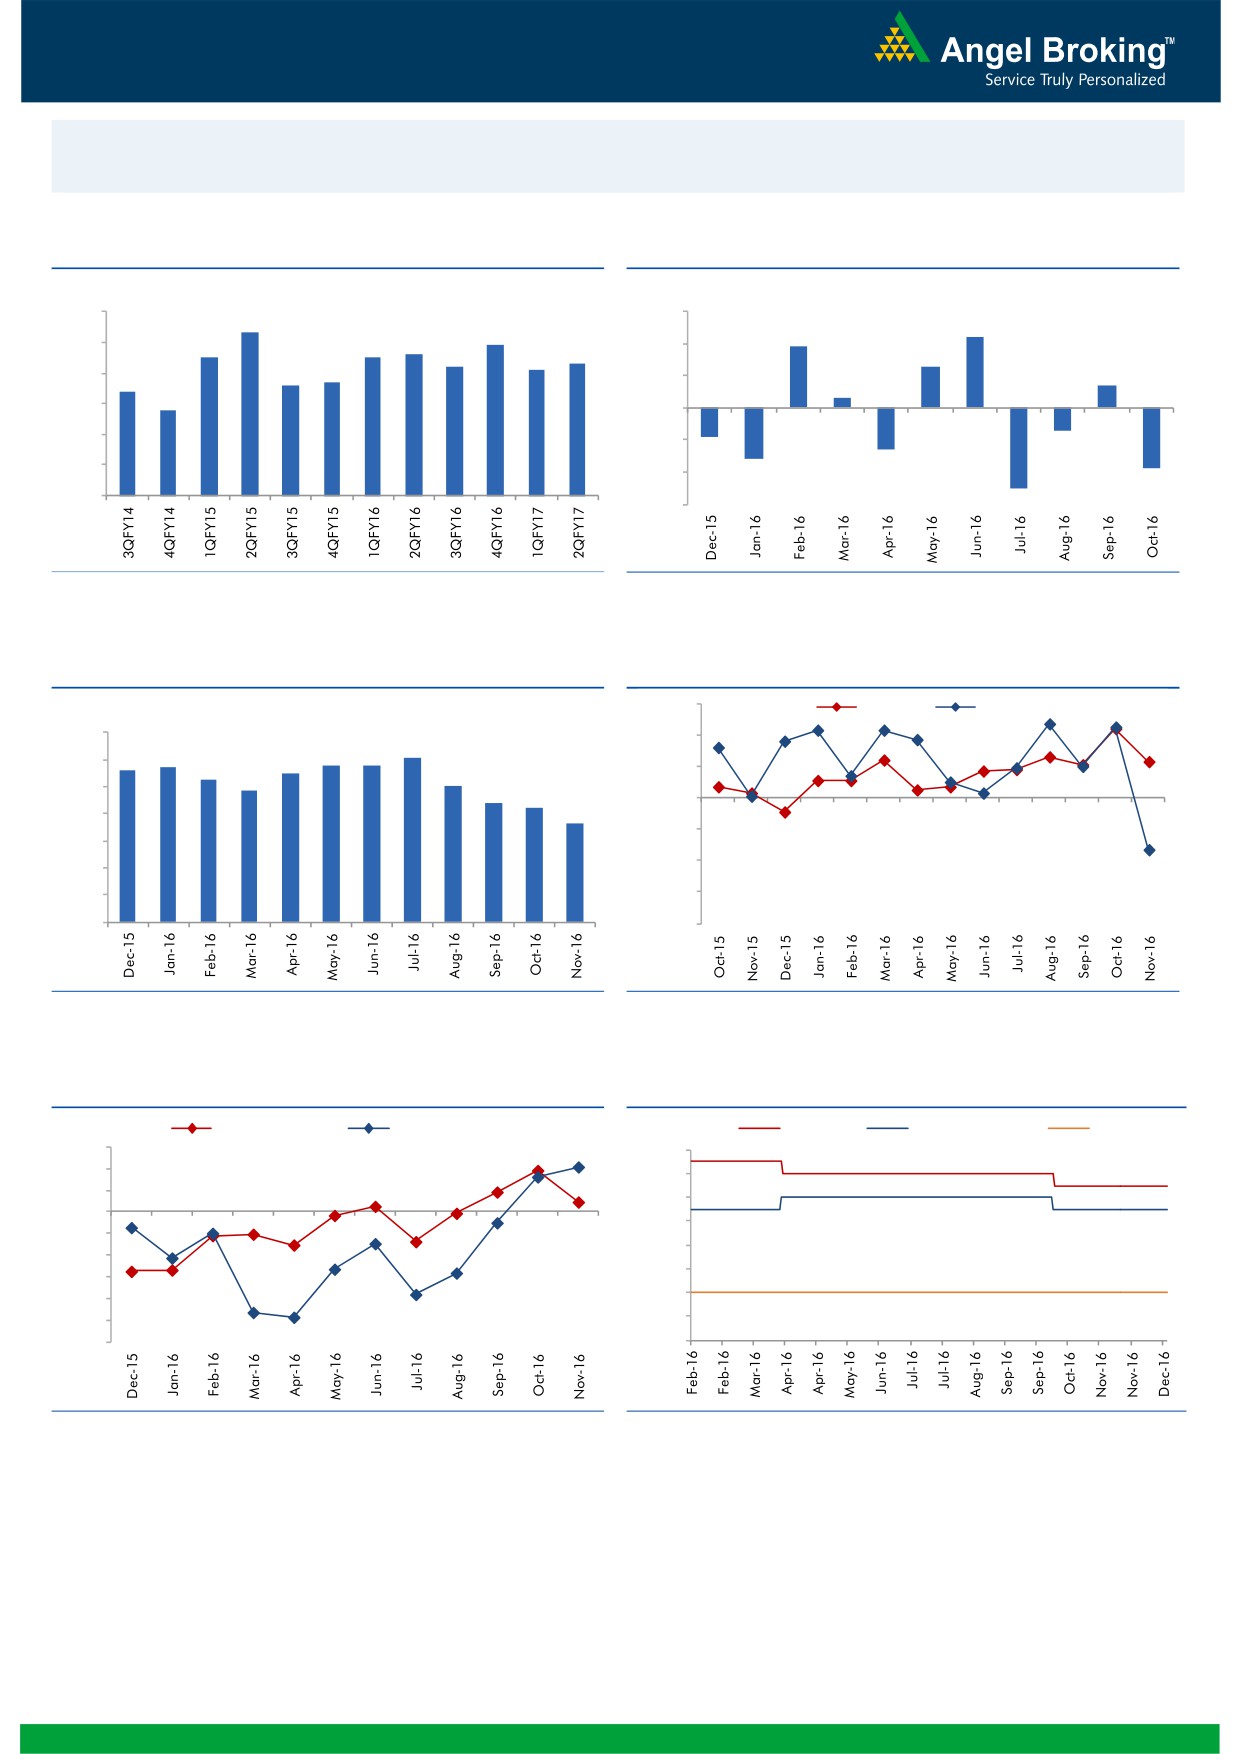
Macro watch
Exhibit 1: Quarterly GDP trends
Exhibit 2: IIP trends
(%)
(%)
9.0
3.0
8.3
2.2
7.9
1.9
7.5
7.5
7.6
8.0
7.3
2.0
7.2
7.1
1.3
6.6
6.7
0.7
7.0
6.4
1.0
0.3
5.8
6.0
-
5.0
(1.0)
(0.7)
(0.9)
4.0
(1.3)
(2.0)
(1.6)
(1.9)
3.0
(3.0)
(2.5)
Source: CSO, Angel Research
Source: MOSPI, Angel Research
Exhibit 3: Monthly CPI inflation trends
Exhibit 4: Manufacturing and services PMI
56.0
Mfg. PMI
Services PMI
(%)
7.0
54.0
6.1
5.6
5.7
5.8
5.8
6.0
5.3
5.5
5.1
52.0
4.8
5.0
4.4
4.2
50.0
3.6
4.0
48.0
3.0
46.0
2.0
1.0
44.0
-
42.0
Source: MOSPI, Angel Research
Source: Market, Angel Research; Note: Level above 50 indicates expansion
Exhibit 5: Exports and imports growth trends
Exhibit 6: Key policy rates
(%)
Exports yoy growth
Imports yoy growth
(%)
Repo rate
Reverse Repo rate
CRR
15.0
7.00
10.0
6.50
5.0
6.00
0.0
5.50
(5.0)
5.00
(10.0)
4.50
(15.0)
(20.0)
4.00
(25.0)
3.50
(30.0)
3.00
Source: Bloomberg, Angel Research
Source: RBI, Angel Research
Market Outlook
December 22, 2016
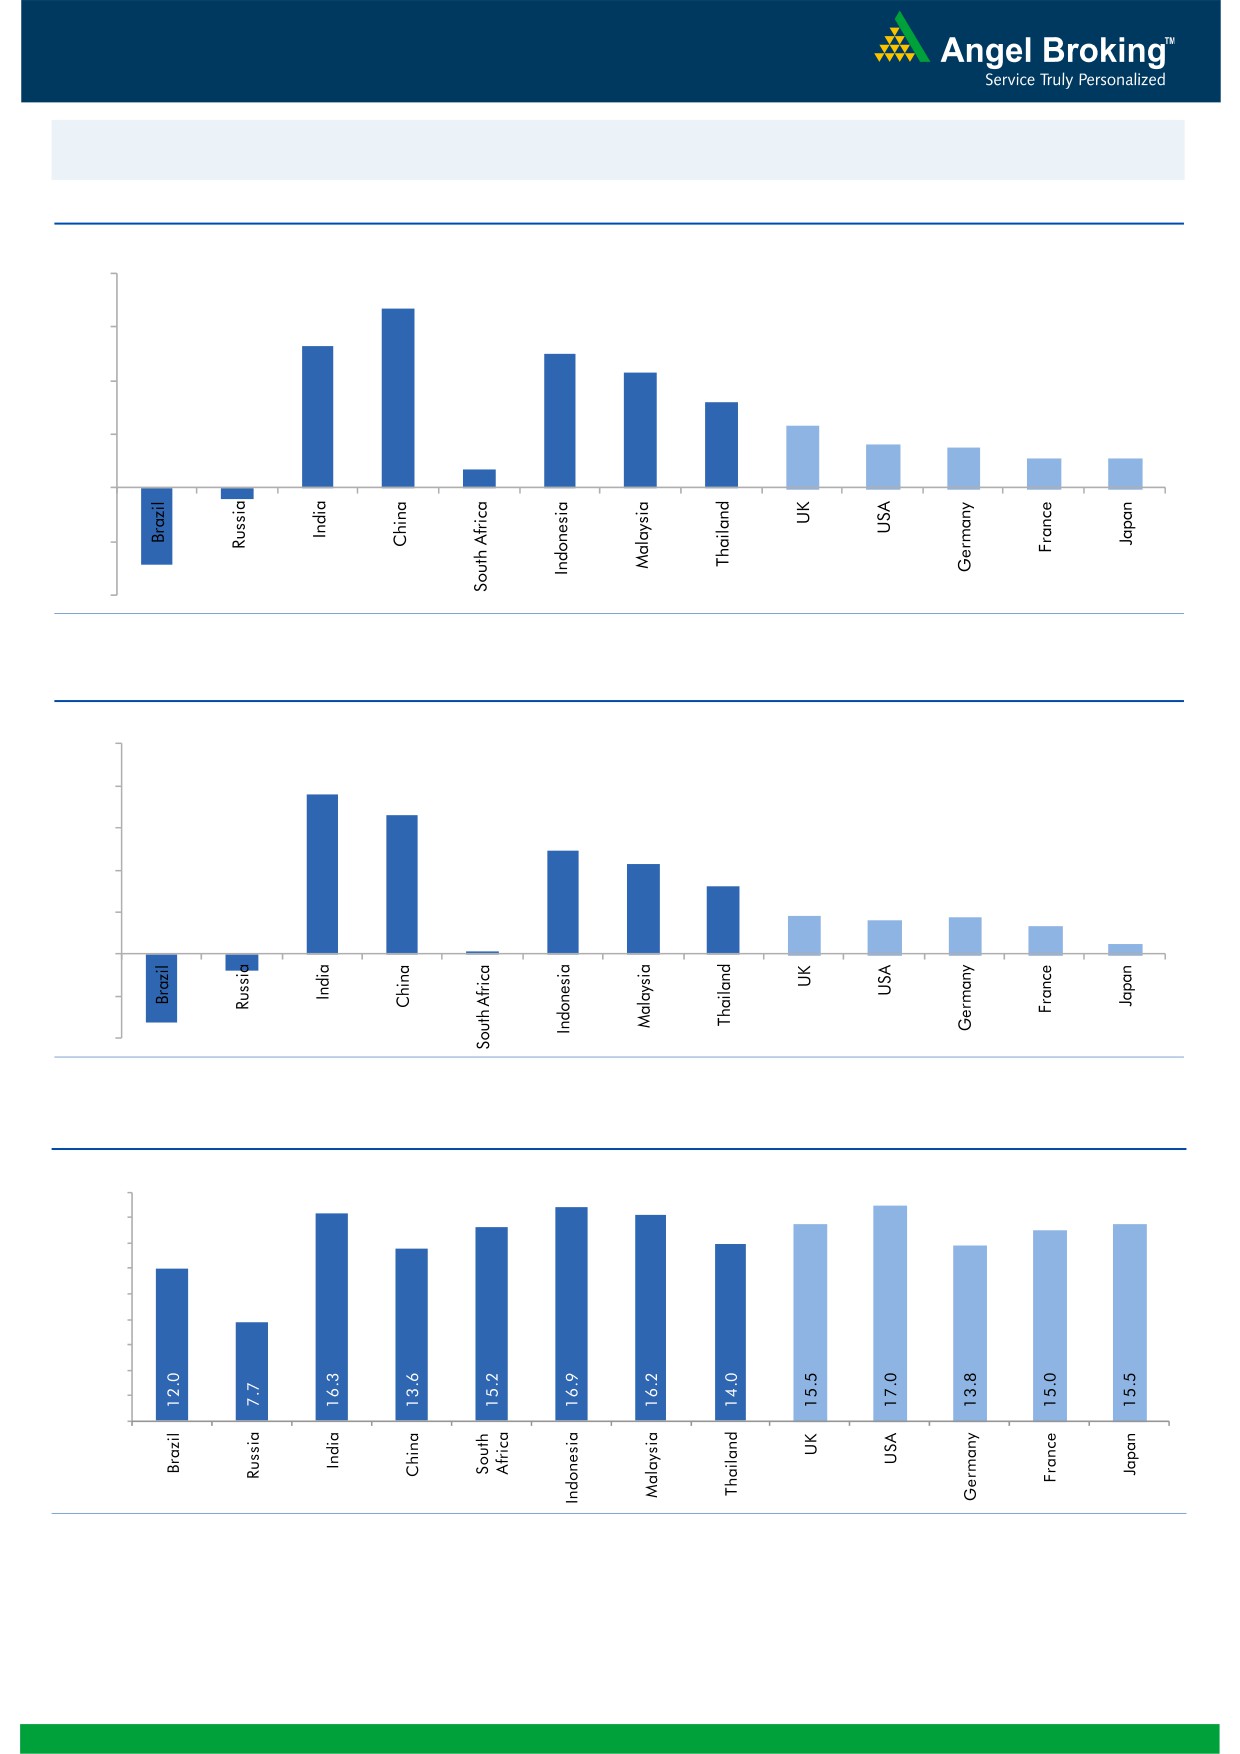
Global watch
Exhibit 1: Latest quarterly GDP Growth (%, yoy) across select developing and developed countries
(%)
8.0
6.7
5.3
6.0
5.0
0.7
4.3
4.0
3.2
2.3
1.6
1.5
2.0
1.1
1.1
-
(2.0)
(0.4)
(2.9)
(4.0)
Source: Bloomberg, Angel Research
Exhibit 2: 2016 GDP Growth projection by IMF (%, yoy) across select developing and developed countries
(%)
10.0
7.6
8.0
6.6
6.0
4.9
4.3
4.0
3.2
1.8
1.7
1.6
1.3
2.0
(0.8)
0.5
(3.3)
0.1
-
(2.0)
(4.0)
Source: IMF, Angel Research
Exhibit 3: One year forward P-E ratio across select developing and developed countries
(x)
18.0
16.0
14.0
12.0
10.0
8.0
6.0
4.0
2.0
-
Source: IMF, Angel Research
Market Outlook
December 22, 2016
Exhibit 4: Relative performance of indices across globe
Returns (%)
Country
Name of index
Closing price
1M
3M
1YR
Brazil
Bovespa
57,647
(5.6)
0.5
28.1
Russia
Micex
2,212
7.5
10.7
28.9
India
Nifty
8,061
1.7
(8.5)
4.7
China
Shanghai Composite
3,137
(3.6)
4.3
(11.0)
South Africa
Top 40
43,564
(1.5)
(1.6)
(1.8)
Mexico
Mexbol
44,983
0.1
(1.9)
3.8
Indonesia
LQ45
847
(2.4)
(8.1)
12.7
Malaysia
KLCI
1,630
0.4
(1.6)
(0.0)
Thailand
SET 50
940
2.4
(1.2)
13.2
USA
Dow Jones
19,942
5.7
9.0
13.3
UK
FTSE
7,041
3.9
1.9
12.6
Japan
Nikkei
19,444
8.2
18.5
1.1
Germany
DAX
11,469
7.3
9.9
7.6
France
CAC
4,834
6.7
7.2
4.2
Source: Bloomberg, Angel Research
Stock Watch
December 22, 2016
Company Name
Reco
CMP
Target
Mkt Cap
Sales ( Čcr )
OPM(%)
EPS (Č)
PER(x)
P/BV(x)
RoE(%)
EV/Sales(x)
(Č)
Price ( Č)
( Č cr )
FY17E FY18E
FY17E
FY18E
FY17E
FY18E
FY17E
FY18E
FY17E
FY18E
FY17E
FY18E
FY17E
FY18E
Agri / Agri Chemical
Rallis
Accumulate
193
209
3,759
1,937
2,164
13.3
14.3
9.0
11.0
21.5
17.6
3.7
3.3
18.4
19.8
2.0
1.7
United Phosphorus
Accumulate
631
684
31,999
15,176
17,604
18.5
18.5
37.4
44.6
16.9
14.2
3.3
2.7
21.4
21.2
2.2
1.9
Auto & Auto Ancillary
Ashok Leyland
Buy
78
111
22,084
22,407
26,022
10.6
10.6
5.2
6.4
14.9
12.1
3.4
2.8
23.6
24.7
1.1
0.9
Bajaj Auto
Neutral
2,586
-
74,820
25,093
27,891
19.5
19.2
143.9
162.5
18.0
15.9
5.0
4.3
30.3
29.4
2.7
2.4
Bharat Forge
Neutral
931
-
21,663
7,726
8,713
20.5
21.2
35.3
42.7
26.4
21.8
4.9
4.4
18.9
20.1
2.9
2.5
Eicher Motors
Neutral
21,305
-
57,956
16,583
20,447
17.5
18.0
598.0
745.2
35.6
28.6
12.2
9.3
41.2
38.3
3.3
2.6
Gabriel India
Buy
108
130
1,555
1,544
1,715
9.0
9.3
5.4
6.3
20.1
17.2
3.8
3.4
18.9
19.5
1.0
0.9
Hero Motocorp
Buy
3,027
3,541
60,440
30,958
34,139
15.7
15.7
193.6
208.3
15.6
14.5
6.1
5.1
34.2
30.5
1.8
1.6
Jamna Auto Industries Neutral
155
-
1,237
1,486
1,620
9.8
9.9
15.0
17.2
10.4
9.0
2.3
1.9
21.8
21.3
0.9
0.8
L G Balakrishnan & Bros Neutral
575
-
903
1,302
1,432
11.6
11.9
43.7
53.0
13.2
10.9
1.9
1.7
13.8
14.2
0.8
0.7
Mahindra and Mahindra Neutral
1,193
-
74,106
46,534
53,077
11.6
11.7
67.3
78.1
17.7
15.3
2.9
2.5
15.4
15.8
1.6
1.3
Maruti
Buy
5,145
6,006
155,410
68,057
82,958
15.8
15.5
212.1
261.2
24.3
19.7
4.8
4.0
19.8
20.3
2.0
1.5
Minda Industries
Neutral
317
-
2,517
2,728
3,042
9.0
9.1
68.2
86.2
4.7
3.7
1.1
0.8
23.8
24.3
1.0
0.8
Motherson Sumi
Neutral
322
-
45,253
45,896
53,687
7.8
8.3
13.0
16.1
24.7
20.0
8.0
6.4
34.7
35.4
1.1
0.9
Rane Brake Lining
Neutral
945
-
748
511
562
11.3
11.5
28.1
30.9
33.6
30.6
5.1
4.7
15.3
15.0
1.6
1.5
Setco Automotive
Neutral
36
-
484
741
837
13.0
13.0
15.2
17.0
2.4
2.1
0.4
0.4
15.8
16.3
1.0
0.9
Tata Motors
Neutral
469
-
135,338
300,209
338,549
8.9
8.4
42.7
54.3
11.0
8.6
1.8
1.5
15.6
17.2
0.6
0.5
TVS Motor
Neutral
370
-
17,597
13,390
15,948
6.9
7.1
12.8
16.5
29.0
22.4
7.2
5.7
26.3
27.2
1.4
1.1
Amara Raja Batteries
Buy
888
1,167
15,160
5,504
6,605
17.6
17.5
33.4
40.9
26.6
21.7
5.9
4.8
22.1
22.0
2.7
2.3
Exide Industries
Neutral
173
-
14,709
7,439
8,307
15.0
15.0
8.1
9.3
21.4
18.6
3.0
2.7
14.3
16.7
1.6
1.4
Apollo Tyres
Buy
192
235
9,776
12,877
14,504
14.3
13.9
21.4
23.0
9.0
8.4
1.4
1.2
16.4
15.2
0.9
0.9
Ceat
Buy
1,153
1,450
4,666
7,524
8,624
13.0
12.7
131.1
144.3
8.8
8.0
1.6
1.4
19.8
18.6
0.7
0.6
JK Tyres
Neutral
112
-
2,540
7,455
8,056
15.0
15.0
21.8
24.5
5.1
4.6
1.1
0.9
22.8
21.3
0.5
0.4
Swaraj Engines
Neutral
1,334
-
1,657
660
810
15.2
16.4
54.5
72.8
24.5
18.3
7.6
6.9
31.5
39.2
2.3
1.9
Subros
Neutral
157
-
943
1,488
1,681
11.7
11.9
6.4
7.2
24.6
21.9
2.6
2.4
10.8
11.4
0.9
0.7
Indag Rubber
Neutral
179
-
471
286
326
19.8
16.8
11.7
13.3
15.3
13.5
2.6
2.4
17.8
17.1
1.3
1.1
Capital Goods
ACE
Neutral
47
-
467
709
814
4.1
4.6
1.4
2.1
33.7
22.5
1.4
1.3
4.4
6.0
0.8
0.7
BEML
Neutral
924
-
3,848
3,451
4,055
6.3
9.2
31.4
57.9
29.4
16.0
1.8
1.6
6.3
10.9
1.2
1.0
Bharat Electronics
Neutral
1,414
-
31,580
8,137
9,169
16.8
17.2
58.7
62.5
24.1
22.6
3.7
3.3
44.6
46.3
2.9
2.6
Stock Watch
December 22, 2016
Company Name
Reco
CMP
Target
Mkt Cap
Sales ( Čcr )
OPM(%)
EPS (Č)
PER(x)
P/BV(x)
RoE(%)
EV/Sales(x)
(Č)
Price ( Č)
( Č cr )
FY17E
FY18E
FY17E
FY18E
FY17E
FY18E
FY17E
FY18E
FY17E
FY18E
FY17E
FY18E
FY17E
FY18E
Capital Goods
Voltas
Buy
310
407
10,241
6,511
7,514
7.9
8.7
12.9
16.3
24.0
19.0
4.3
3.8
16.7
18.5
1.3
1.1
BGR Energy
Neutral
112
-
811
16,567
33,848
6.0
5.6
7.8
5.9
14.4
19.0
0.8
0.8
4.7
4.2
0.2
0.1
BHEL
Neutral
121
-
29,604
28,797
34,742
-
2.8
2.3
6.9
52.6
17.5
0.9
0.9
1.3
4.8
0.7
0.5
Blue Star
Buy
460
634
4,393
4,283
5,077
5.9
7.3
14.9
22.1
30.9
20.8
6.0
5.1
20.4
26.4
1.1
0.9
Crompton Greaves
Neutral
58
-
3,623
5,777
6,120
5.9
7.0
3.3
4.5
17.5
12.8
0.8
0.7
4.4
5.9
0.6
0.5
Greaves Cotton
Neutral
121
-
2,963
1,755
1,881
16.8
16.9
7.8
8.5
15.6
14.3
3.1
2.9
20.6
20.9
1.4
1.2
Inox Wind
Neutral
191
-
4,239
5,605
6,267
15.7
16.4
24.8
30.0
7.7
6.4
2.2
1.6
25.9
24.4
0.8
0.7
KEC International
Neutral
138
-
3,541
9,294
10,186
7.9
8.1
9.9
11.9
13.9
11.6
2.0
1.8
15.6
16.3
0.6
0.6
Thermax
Neutral
789
-
9,406
5,421
5,940
7.3
7.3
25.7
30.2
30.7
26.1
3.7
3.4
12.2
13.1
1.6
1.5
VATech Wabag
Buy
463
681
2,524
3,136
3,845
8.9
9.1
26.0
35.9
17.8
12.9
2.2
1.9
13.4
15.9
0.7
0.6
Cement
ACC
Neutral
1,301
-
24,425
11,225
13,172
13.2
16.9
44.5
75.5
29.2
17.2
2.8
2.6
11.2
14.2
2.2
1.9
Ambuja Cements
Neutral
202
-
40,180
9,350
10,979
18.2
22.5
5.8
9.5
34.9
21.3
2.9
2.6
10.2
12.5
4.3
3.7
India Cements
Neutral
113
-
3,479
4,364
4,997
18.5
19.2
7.9
11.3
14.3
10.0
1.0
1.0
8.0
8.5
1.6
1.4
JK Cement
Neutral
661
-
4,624
4,398
5,173
15.5
17.5
31.2
55.5
21.2
11.9
2.5
2.2
12.0
15.5
1.6
1.3
J K Lakshmi Cement
Buy
340
565
3,998
2,913
3,412
14.5
19.5
7.5
22.5
45.3
15.1
2.8
2.3
12.5
18.0
2.0
1.6
Orient Cement
Buy
124
215
2,540
2,114
2,558
18.5
20.5
8.1
11.3
15.3
11.0
2.3
1.9
9.0
14.0
1.8
1.4
UltraTech Cement
Neutral
3,192
-
87,619
25,768
30,385
21.0
23.5
111.0
160.0
28.8
20.0
3.7
3.2
13.5
15.8
3.5
2.9
Construction
ITNL
Neutral
105
-
3,466
8,946
10,017
31.0
31.6
8.1
9.1
13.0
11.6
0.5
0.5
4.2
5.0
3.7
3.5
KNR Constructions
Buy
169
802
2,381
1,385
1,673
14.7
14.0
41.2
48.5
4.1
3.5
0.8
0.7
14.9
15.2
1.8
1.5
Larsen & Toubro
Buy
1,342
1,634
125,198
111,017
124,908
11.0
11.0
61.1
66.7
22.0
20.1
2.6
2.5
13.1
12.9
2.2
2.0
Gujarat Pipavav Port
Neutral
135
-
6,546
705
788
52.2
51.7
5.0
5.6
27.1
24.2
2.7
2.4
11.2
11.2
8.9
7.5
Nagarjuna Const.
Neutral
81
-
4,500
8,842
9,775
9.1
8.8
5.3
6.4
15.3
12.7
1.2
1.1
8.2
9.1
0.7
0.6
PNC Infratech
Buy
105
143
2,705
2,350
2,904
13.1
13.2
9.0
8.8
11.7
12.0
0.4
0.4
15.9
13.9
1.3
1.0
Simplex Infra
Neutral
277
-
1,370
6,829
7,954
10.5
10.5
31.4
37.4
8.8
7.4
0.9
0.8
9.9
13.4
0.6
0.5
Power Mech Projects
Neutral
446
-
657
1,801
2,219
12.7
14.6
72.1
113.9
6.2
3.9
1.1
1.0
16.8
11.9
0.4
0.3
Sadbhav Engineering
Accumulate
269
298
4,614
3,598
4,140
10.3
10.6
9.0
11.9
29.9
22.6
3.1
2.7
9.9
11.9
1.6
1.3
NBCC
Neutral
227
-
13,599
7,428
9,549
7.9
8.6
8.2
11.0
27.6
20.6
1.4
1.1
28.2
28.7
1.5
1.1
MEP Infra
Neutral
36
-
586
1,877
1,943
30.6
29.8
3.0
4.2
12.0
8.6
5.8
3.9
0.6
0.6
1.7
1.5
SIPL
Neutral
98
-
3,434
1,036
1,252
65.5
66.2
(8.4)
(5.6)
3.7
4.2
(22.8)
(15.9)
11.5
9.6
Stock Watch
December 22, 2016
Company Name
Reco
CMP
Target
Mkt Cap
Sales ( Čcr )
OPM(%)
EPS (Č)
PER(x)
P/BV(x)
RoE(%)
EV/Sales(x)
(Č)
Price ( Č)
( Č cr )
FY17E
FY18E
FY17E
FY18E
FY17E
FY18E
FY17E
FY18E
FY17E
FY18E
FY17E
FY18E
FY17E
FY18E
Construction
Engineers India
Neutral
318
-
10,713
1,725
1,935
16.0
19.1
11.4
13.9
27.9
22.9
3.8
3.7
13.4
15.3
5.1
4.6
Financials
Axis Bank
Buy
458
630
109,492
46,932
53,575
3.5
3.4
32.4
44.6
14.2
10.3
1.8
1.6
13.6
16.5
-
-
Bank of Baroda
Neutral
157
-
36,210
19,980
23,178
1.8
1.8
11.5
17.3
13.7
9.1
1.6
1.3
8.3
10.1
-
-
Canara Bank
Neutral
290
-
15,720
15,225
16,836
1.8
1.8
14.5
28.0
20.0
10.3
1.4
1.1
5.8
8.5
-
-
Dewan Housing Finance Buy
236
350
7,388
2,225
2,688
2.9
2.9
29.7
34.6
7.9
6.8
1.3
1.1
16.1
16.8
-
-
Equitas Holdings
Buy
147
235
4,937
939
1,281
11.7
11.5
5.8
8.2
25.4
18.0
2.2
2.0
10.9
11.5
-
-
Federal Bank
Neutral
67
-
11,537
9,353
10,623
2.9
2.9
4.4
5.8
15.2
11.6
1.5
1.3
9.5
11.0
-
-
HDFC
Neutral
1,237
-
195,727
11,475
13,450
3.4
3.4
45.3
52.5
27.3
23.6
5.3
4.7
20.2
20.5
-
-
HDFC Bank
Accumulate
1,180
1,350
301,241
46,097
55,433
4.5
4.5
58.4
68.0
20.2
17.4
3.5
3.0
18.8
18.6
-
-
ICICI Bank
Buy
253
315
147,451
42,800
44,686
3.1
3.3
18.0
21.9
14.1
11.6
1.9
1.8
11.1
12.3
-
-
Lakshmi Vilas Bank
Buy
142
174
2,541
3,339
3,799
2.7
2.8
11.0
14.0
12.9
10.1
1.3
1.2
11.2
12.7
-
-
LIC Housing Finance
Buy
543
630
27,426
3,712
4,293
2.6
2.5
39.0
46.0
13.9
11.8
2.6
2.2
19.9
20.1
-
-
Punjab Natl.Bank
Neutral
121
-
25,653
23,532
23,595
2.3
2.4
6.8
12.6
17.7
9.6
2.7
1.9
3.3
6.5
-
-
RBL Bank
Neutral
344
-
12,729
1,783
2,309
2.6
2.6
12.7
16.4
27.1
21.0
3.0
2.6
12.8
13.3
-
-
South Ind.Bank
Neutral
21
-
2,818
6,435
7,578
2.5
2.5
2.7
3.1
7.7
6.7
1.0
0.8
10.1
11.2
-
-
St Bk of India
Neutral
255
-
198,067
88,650
98,335
2.6
2.6
13.5
18.8
18.9
13.6
1.8
1.6
7.0
8.5
-
-
Union Bank
Neutral
128
-
8,803
13,450
14,925
2.3
2.3
25.5
34.5
5.0
3.7
0.7
0.6
7.5
10.2
-
-
Yes Bank
Neutral
1,138
-
48,121
8,978
11,281
3.3
3.4
74.0
90.0
15.4
12.7
2.9
2.5
17.0
17.2
-
-
FMCG
Asian Paints
Neutral
866
-
83,095
17,128
18,978
16.8
16.4
19.1
20.7
45.4
41.9
15.8
14.9
34.8
35.5
4.8
4.3
Britannia
Buy
2,847
3,626
34,165
9,594
11,011
14.6
14.9
80.3
94.0
35.5
30.3
14.6
11.3
41.2
-
3.4
2.9
Colgate
Accumulate
907
995
24,658
4,605
5,149
23.4
23.4
23.8
26.9
38.1
33.7
21.1
16.5
64.8
66.8
5.3
4.7
Dabur India
Accumulate
272
304
47,852
8,315
9,405
19.8
20.7
8.1
9.2
33.5
29.5
9.3
7.7
31.6
31.0
5.4
4.7
GlaxoSmith Con*
Neutral
4,996
-
21,009
4,350
4,823
21.2
21.4
179.2
196.5
27.9
25.4
7.4
6.3
27.1
26.8
4.2
3.7
Godrej Consumer
Neutral
1,447
-
49,271
10,235
11,428
18.4
18.6
41.1
44.2
35.2
32.7
7.8
6.6
24.9
24.8
4.9
4.3
HUL
Neutral
797
-
172,395
35,252
38,495
17.8
17.8
20.7
22.4
38.6
35.6
36.9
31.6
95.6
88.9
4.7
4.3
ITC
Buy
226
284
274,019
40,059
44,439
38.3
39.2
9.0
10.1
25.2
22.3
7.0
6.1
27.8
27.5
6.3
5.7
Marico
Buy
250
300
32,199
6,430
7,349
18.8
19.5
6.4
7.7
39.0
32.4
11.8
9.9
33.2
32.5
4.8
4.2
Nestle*
Neutral
5,857
-
56,472
10,073
11,807
20.7
21.5
124.8
154.2
46.9
38.0
19.3
17.3
34.8
36.7
5.4
4.6
Tata Global
Neutral
122
-
7,675
8,675
9,088
9.8
9.8
7.4
8.2
16.4
14.8
1.9
1.8
7.9
8.1
0.8
0.7
Stock Watch
December 22, 2016
Company Name
Reco
CMP
Target
Mkt Cap
Sales ( Čcr )
OPM(%)
EPS (Č)
PER(x)
P/BV(x)
RoE(%)
EV/Sales(x)
(Č)
Price ( Č)
( Č cr )
FY17E FY18E
FY17E
FY18E
FY17E
FY18E
FY17E
FY18E
FY17E
FY18E
FY17E
FY18E
FY17E
FY18E
FMCG
Procter & Gamble
Accumulate
6,772
7,369
21,981
2,939
3,342
23.2
23.0
146.2
163.7
46.3
41.4
103.7
99.4
25.3
23.5
7.0
6.1
Hygiene
IT
HCL Tech^
Buy
820
1,000
115,755
49,242
57,168
20.5
20.5
55.7
64.1
14.7
12.8
3.0
2.3
20.3
17.9
2.2
1.8
Infosys
Buy
1,004
1,249
230,544
68,350
77,326
27.0
27.0
62.5
69.4
16.1
14.5
3.4
3.1
21.3
21.6
2.8
2.4
TCS
Accumulate
2,313
2,620
455,711
119,025
133,308
27.6
27.6
131.2
145.5
17.6
15.9
5.7
5.3
32.4
33.1
3.6
3.2
Tech Mahindra
Buy
475
600
46,260
29,673
32,937
15.5
17.0
32.8
39.9
14.5
11.9
2.8
2.5
19.6
20.7
1.3
1.1
Wipro
Buy
463
590
112,440
55,440
60,430
18.1
18.1
35.9
39.9
12.9
11.6
2.3
2.1
19.0
19.3
1.7
1.6
Media
D B Corp
Neutral
350
-
6,434
2,297
2,590
27.4
28.2
21.0
23.4
16.7
15.0
3.9
3.4
23.7
23.1
2.6
2.2
HT Media
Neutral
74
-
1,721
2,693
2,991
12.6
12.9
7.9
9.0
9.4
8.2
0.8
0.7
7.8
8.3
0.2
0.1
Jagran Prakashan
Buy
170
225
5,559
2,355
2,635
28.0
28.0
10.8
12.5
15.7
13.6
3.4
3.0
21.7
21.7
2.4
2.1
Sun TV Network
Neutral
490
-
19,304
2,850
3,265
70.1
71.0
26.2
30.4
18.7
16.1
4.8
4.2
24.3
25.6
6.4
5.4
Hindustan Media
Neutral
273
-
2,006
1,016
1,138
24.3
25.2
27.3
30.1
10.0
9.1
1.9
1.7
16.2
15.8
1.3
1.1
Ventures
TV Today Network
Buy
266
385
1,586
637
743
27.5
27.5
18.4
21.4
14.5
12.4
2.5
2.1
17.4
17.2
2.1
1.7
Metals & Mining
Coal India
Neutral
292
-
181,256
84,638
94,297
21.4
22.3
24.5
27.1
11.9
10.8
5.0
4.7
42.6
46.0
1.7
1.5
Hind. Zinc
Neutral
267
-
112,879
14,252
18,465
55.9
48.3
15.8
21.5
16.9
12.4
2.8
2.4
17.0
20.7
7.9
6.1
Hindalco
Neutral
169
-
34,874
107,899
112,095
7.4
8.2
9.2
13.0
18.4
13.0
0.9
0.8
4.8
6.6
0.8
0.8
JSW Steel
Neutral
1,589
-
38,412
53,201
58,779
16.1
16.2
130.6
153.7
12.2
10.3
1.6
1.4
14.0
14.4
1.5
1.3
NMDC
Neutral
126
-
39,881
6,643
7,284
44.4
47.7
7.1
7.7
17.8
16.4
1.5
1.5
8.8
9.2
3.8
3.4
SAIL
Neutral
51
-
21,167
47,528
53,738
(0.7)
2.1
(1.9)
2.6
19.7
0.6
0.5
(1.6)
3.9
1.3
1.2
Vedanta
Neutral
226
-
67,032
71,744
81,944
19.2
21.7
13.4
20.1
16.9
11.3
1.4
1.3
8.4
11.3
1.3
1.0
Tata Steel
Neutral
405
-
39,325
121,374
121,856
7.2
8.4
18.6
34.3
21.8
11.8
1.4
1.2
6.1
10.1
1.0
0.9
Oil & Gas
Cairn India
Neutral
253
-
47,431
9,127
10,632
4.3
20.6
8.8
11.7
28.7
21.6
0.9
0.9
3.3
4.2
6.7
5.5
GAIL
Neutral
430
-
54,538
56,220
65,198
9.3
10.1
27.1
33.3
15.9
12.9
1.5
1.4
9.3
10.7
1.2
1.0
ONGC
Neutral
201
-
258,525
137,222
152,563
15.0
21.8
19.5
24.1
10.3
8.4
0.9
0.8
8.5
10.1
2.2
1.9
Indian Oil Corp
Neutral
309
-
150,023
373,359
428,656
5.9
5.5
54.0
59.3
5.7
5.2
0.9
0.8
16.0
15.6
0.6
0.5
Reliance Industries
Neutral
1,061
-
344,291
301,963
358,039
12.1
12.6
87.7
101.7
12.1
10.4
1.2
1.1
10.7
11.3
1.6
1.3
Pharmaceuticals
Alembic Pharma
Neutral
626
-
11,794
3,483
4,083
20.2
21.4
24.3
30.4
25.7
20.6
5.9
4.7
25.5
25.3
3.3
2.8
Alkem Laboratories Ltd
Buy
1,626
1,989
19,445
6,043
6,893
18.7
19.3
80.5
88.8
20.2
18.3
4.5
3.7
22.3
20.3
3.2
2.7
Aurobindo Pharma
Buy
666
877
38,999
15,720
18,078
23.7
23.7
41.4
47.3
16.1
14.1
4.2
3.3
29.6
26.1
2.7
2.3
Sanofi India*
Neutral
4,243
-
9,771
2,277
2,597
17.3
18.3
149.4
172.0
28.4
24.7
4.7
3.8
25.1
28.8
4.0
3.2
Stock Watch
December 22, 2016
Company Name
Reco
CMP
Target
Mkt Cap
Sales ( Čcr )
OPM(%)
EPS (Č)
PER(x)
P/BV(x)
RoE(%)
EV/Sales(x)
(Č)
Price ( Č)
( Č cr )
FY17E FY18E
FY17E
FY18E
FY17E
FY18E
FY17E
FY18E
FY17E
FY18E
FY17E
FY18E
FY17E
FY18E
Pharmaceuticals
Cadila Healthcare
Accumulate
368
400
37,694
10,429
12,318
22.6
22.0
16.9
19.2
21.8
19.2
5.6
4.5
28.5
25.7
3.6
3.0
Cipla
Reduce
563
490
45,268
15,378
18,089
17.4
18.4
21.6
27.2
26.1
20.7
3.4
2.9
13.7
15.2
3.1
2.6
Dr Reddy's
Neutral
3,043
-
50,403
16,043
18,119
20.8
22.4
112.4
142.9
27.1
21.3
3.6
3.2
14.1
15.9
3.1
2.7
Dishman Pharma
Neutral
218
-
3,520
1,718
1,890
22.7
22.8
9.5
11.3
23.0
19.3
2.2
2.0
10.1
10.9
2.5
2.2
GSK Pharma*
Neutral
2,722
-
23,052
3,000
3,312
15.4
20.6
46.5
60.8
58.5
44.8
14.1
14.0
26.3
30.6
7.4
6.8
Indoco Remedies
Reduce
261
240
2,405
1,112
1,289
16.2
18.2
11.6
16.0
22.5
16.3
3.6
3.0
17.0
20.1
2.3
1.9
Ipca labs
Accumulate
536
613
6,766
3,303
3,799
15.3
15.3
17.3
19.7
31.0
27.2
2.7
2.5
9.1
9.4
2.2
1.9
Lupin
Buy
1,466
1,809
66,164
15,912
18,644
26.4
26.7
58.1
69.3
25.2
21.2
4.9
4.0
21.4
20.9
4.2
3.5
Sun Pharma
Buy
614
847
147,407
31,129
35,258
32.0
32.9
30.2
35.3
20.3
17.4
3.3
2.7
20.0
20.1
4.3
3.6
Power
Tata Power
Neutral
76
-
20,569
36,916
39,557
17.4
27.1
5.1
6.3
14.9
12.1
1.3
1.2
9.0
10.3
1.6
1.4
NTPC
Neutral
164
-
135,061
86,605
95,545
17.5
20.8
11.8
13.4
13.9
12.2
1.4
1.3
10.5
11.1
2.9
2.9
Power Grid
Buy
183
223
95,947
25,315
29,193
88.2
88.7
14.2
17.2
13.0
10.7
2.0
1.7
15.2
16.1
8.4
7.6
Real Estate
MLIFE
Buy
355
522
1,457
1,152
1,300
22.7
24.6
29.9
35.8
11.9
9.9
0.9
0.8
7.6
8.6
2.0
1.6
Telecom
Bharti Airtel
Neutral
302
-
120,781
105,086
114,808
34.5
34.7
12.2
16.4
24.8
18.4
1.7
1.6
6.8
8.4
2.1
1.8
Idea Cellular
Neutral
73
-
26,308
40,133
43,731
37.2
37.1
6.4
6.5
11.4
11.2
1.0
0.9
8.2
7.6
1.7
1.4
zOthers
Abbott India
Neutral
4,584
-
9,740
3,153
3,583
14.1
14.4
152.2
182.7
30.1
25.1
147.9
126.3
25.6
26.1
2.8
2.4
Bajaj Electricals
Buy
216
274
2,181
4,801
5,351
5.7
6.2
10.4
13.7
20.7
15.8
2.6
2.3
12.4
14.5
0.5
0.4
Finolex Cables
Neutral
408
-
6,242
2,883
3,115
12.0
12.1
14.2
18.6
28.7
21.9
15.3
13.4
15.8
14.6
1.9
1.7
Goodyear India*
Neutral
688
-
1,587
1,598
1,704
10.4
10.2
49.4
52.6
13.9
13.1
64.3
56.4
18.2
17.0
0.7
93.7
Hitachi
Neutral
1,424
-
3,871
2,081
2,433
8.8
8.9
33.4
39.9
42.6
35.7
34.4
28.7
22.1
21.4
1.9
1.6
Jyothy Laboratories
Neutral
344
-
6,254
1,440
2,052
11.5
13.0
8.5
10.0
40.5
34.4
9.8
9.1
18.6
19.3
4.6
3.2
Page Industries
Neutral
13,758
-
15,346
2,450
3,124
20.1
17.6
299.0
310.0
46.0
44.4
306.4
233.9
47.1
87.5
6.3
5.0
Relaxo Footwears
Neutral
406
-
4,874
2,085
2,469
9.2
8.2
7.6
8.0
53.7
51.1
20.8
17.8
17.9
18.8
2.4
2.1
Siyaram Silk Mills
Accumulate
1,230
1,605
1,153
1,733
1,948
11.6
11.7
96.6
114.7
12.7
10.7
2.0
1.7
15.3
15.7
0.9
0.8
Styrolution ABS India*
Neutral
585
-
1,029
1,440
1,537
9.2
9.0
40.6
42.6
14.4
13.7
36.8
33.5
12.3
11.6
0.7
0.6
TVS Srichakra
Neutral
3,197
-
2,448
2,304
2,614
13.7
13.8
231.1
266.6
13.8
12.0
359.2
282.8
33.9
29.3
1.1
0.9
HSIL
Neutral
281
-
2,030
2,384
2,515
15.8
16.3
15.3
19.4
18.4
14.5
18.2
15.7
7.8
9.3
1.0
0.9
Kirloskar Engines India
Neutral
325
-
4,700
2,554
2,800
9.9
10.0
10.5
12.1
31.0
26.9
13.0
12.2
10.7
11.7
1.5
1.3
Ltd
M M Forgings
Neutral
450
-
543
546
608
20.4
20.7
41.3
48.7
10.9
9.2
61.6
54.6
16.6
17.0
0.8
0.8
Stock Watch
December 22, 2016
Company Name
Reco
CMP
Target
Mkt Cap
Sales ( Čcr )
OPM(%)
EPS (Č)
PER(x)
P/BV(x)
RoE(%)
EV/Sales(x)
(Č)
Price ( Č)
( Č cr )
FY17E
FY18E
FY17E
FY18E
FY17E
FY18E
FY17E
FY18E
FY17E
FY18E
FY17E
FY18E
FY17E
FY18E
zOthers
Banco Products (India) Neutral
181
-
1,291
1,353
1,471
12.3
12.4
14.5
16.3
12.5
11.1
17.2
15.5
14.5
14.6
0.9
95.6
Competent Automobiles Neutral
168
-
103
1,137
1,256
3.1
2.7
28.0
23.6
6.0
7.1
32.3
29.2
14.3
11.5
0.1
0.1
Nilkamal
Neutral
1,278
-
1,907
1,995
2,165
10.7
10.4
69.8
80.6
18.3
15.9
73.0
63.4
16.6
16.5
1.0
0.8
Visaka Industries
Neutral
183
-
291
1,051
1,138
10.3
10.4
21.0
23.1
8.7
7.9
23.5
22.0
9.0
9.2
0.5
0.5
Transport Corporation of
Neutral
157
-
1,200
2,671
2,911
8.5
8.8
13.9
15.7
11.3
10.0
1.5
1.4
13.7
13.8
0.6
0.5
India
Elecon Engineering
Neutral
57
-
642
1,482
1,660
13.7
14.5
3.9
5.8
14.7
9.9
3.5
3.2
7.8
10.9
0.8
0.7
Surya Roshni
Neutral
177
-
774
3,342
3,625
7.8
7.5
17.3
19.8
10.2
8.9
19.4
15.6
10.5
10.8
0.5
0.4
MT Educare
Neutral
113
-
451
366
417
17.7
18.2
9.4
10.8
12.1
10.5
2.7
2.3
22.2
22.3
1.1
1.0
Radico Khaitan
Buy
111
147
1,470
1,667
1,824
13.0
13.2
6.7
8.2
16.6
13.5
1.5
1.4
9.0
10.2
1.3
1.1
Garware Wall Ropes
Neutral
630
-
1,379
873
938
14.3
14.3
35.2
37.5
17.9
16.8
3.1
2.7
17.5
15.9
1.5
1.4
Wonderla Holidays
Neutral
339
-
1,913
287
355
38.0
40.0
11.3
14.2
30.0
23.9
4.3
3.8
21.4
23.9
6.4
5.2
Linc Pen & Plastics
Neutral
229
-
339
382
420
9.3
9.5
13.5
15.7
17.0
14.6
2.9
2.5
17.1
17.3
1.0
0.9
The Byke Hospitality
Neutral
168
-
674
287
384
20.5
20.5
7.6
10.7
22.1
15.7
4.6
3.7
20.7
23.5
2.4
1.8
Interglobe Aviation
Neutral
830
-
30,002
21,122
26,005
14.5
27.6
110.7
132.1
7.5
6.3
44.9
32.1
168.5
201.1
1.4
1.1
Coffee Day Enterprises
Neutral
196
-
4,038
2,964
3,260
20.5
21.2
4.7
8.0
-
24.5
2.3
2.1
5.5
8.5
1.8
1.6
Ltd
Navneet Education
Neutral
111
-
2,635
1,062
1,147
24.0
24.0
6.1
6.6
18.2
16.7
3.7
3.3
20.6
19.8
2.6
2.4
Navkar Corporation
Buy
168
265
2,395
369
561
42.9
42.3
7.2
11.5
23.3
14.6
1.7
1.5
7.4
10.5
7.5
4.9
UFO Moviez
Neutral
413
-
1,139
619
685
33.2
33.4
30.0
34.9
13.8
11.8
1.9
1.6
13.8
13.9
1.5
1.2
VRL Logistics
Neutral
269
-
2,451
1,902
2,119
16.7
16.6
14.6
16.8
18.4
16.0
4.0
3.6
21.9
22.2
1.4
1.2
Team Lease Serv.
Neutral
867
-
1,483
3,229
4,001
1.5
1.8
22.8
32.8
38.1
26.4
4.1
3.5
10.7
13.4
0.4
0.3
S H Kelkar & Co.
Neutral
293
-
4,235
1,036
1,160
15.1
15.0
6.1
7.2
48.0
40.8
5.1
4.7
10.7
11.5
4.0
3.5
Quick Heal
Neutral
263
-
1,840
408
495
27.3
27.0
7.7
8.8
33.9
29.9
3.2
3.2
9.3
10.6
3.7
3.0
Narayana Hrudaya
Neutral
333
-
6,809
1,873
2,166
11.5
11.7
2.6
4.0
126.0
84.0
7.7
7.0
6.1
8.3
3.7
3.2
Manpasand Bever.
Neutral
547
-
3,132
836
1,087
19.6
19.4
16.9
23.8
32.4
23.0
3.9
3.4
12.0
14.8
3.5
2.6
Parag Milk Foods
Neutral
258
-
2,174
1,919
2,231
9.3
9.6
9.5
12.9
27.4
20.0
4.3
3.5
15.5
17.5
1.3
1.1
Mirza International
Buy
85
107
1,022
987
1,106
18.0
18.0
6.5
7.6
13.0
11.2
2.1
1.8
15.9
15.7
1.2
1.1
Asian Granito
Buy
224
351
674
1,071
1,182
12.1
12.4
12.7
16.0
17.6
14.0
1.7
1.5
9.5
10.7
0.9
0.8
Source: Company, Angel Research; Note: *December year end; #September year end; &October year end; Price as on December 21, 2016
Market Outlook
December 22, 2016
Research Team Tel: 022 - 39357800
DISCLAIMER
Angel Broking Private Limited (hereinafter referred to as “Angel”) is a registered Member of National Stock Exchange of India
Limited,Bombay Stock Exchange Limited and Metropolitan Stock Exchange Limited. It is also registered as a Depository Participant with
CDSL and Portfolio Manager with SEBI. It also has registration with AMFI as a Mutual Fund Distributor. Angel Broking Private Limited is a
registered entity with SEBI for Research Analyst in terms of SEBI (Research Analyst) Regulations, 2014 vide registration number
INH000000164. Angel or its associates has not been debarred/ suspended by SEBI or any other regulatory authority for accessing
/dealing in securities Market. Angel or its associates/analyst has not received any compensation / managed or
co-managed public offering of securities of the company covered by Analyst during the past twelve months.
This document is solely for the personal information of the recipient, and must not be singularly used as the basis of any investment
decision. Nothing in this document should be construed as investment or financial advice. Each recipient of this document should make
such investigations as they deem necessary to arrive at an independent evaluation of an investment in the securities of the companies
referred to in this document (including the merits and risks involved), and should consult their own advisors to determine the merits and
risks of such an investment.
Reports based on technical and derivative analysis center on studying charts of a stock's price movement, outstanding positions and
trading volume, as opposed to focusing on a company's fundamentals and, as such, may not match with a report on a company's
fundamentals. Investors are advised to refer the Fundamental and Technical Research Reports available on our website to evaluate the
contrary view, if any.
The information in this document has been printed on the basis of publicly available information, internal data and other reliable
sources believed to be true, but we do not represent that it is accurate or complete and it should not be relied on as such, as this
document is for general guidance only. Angel Broking Pvt. Limited or any of its affiliates/ group companies shall not be in any way
responsible for any loss or damage that may arise to any person from any inadvertent error in the information contained in this report.
Angel Broking Pvt. Limited has not independently verified all the information contained within this document. Accordingly, we cannot
testify, nor make any representation or warranty, express or implied, to the accuracy, contents or data contained within this document.
While Angel Broking Pvt. Limited endeavors to update on a reasonable basis the information discussed in this material, there may be
regulatory, compliance, or other reasons that prevent us from doing so.
This document is being supplied to you solely for your information, and its contents, information or data may not be reproduced,
redistributed or passed on, directly or indirectly.
Neither Angel Broking Pvt. Limited, nor its directors, employees or affiliates shall be liable for any loss or damage that may arise from
or in connection with the use of this information.